Tech Law Journal Congressional Scorecard 1998
Congressional Parties and High Tech
(January 5, 1999) Tech Law Journal examined whether Republicans
and Democrats in Congress differ in their support for high tech. There is a strong
correlation between party affiliation and support for high tech. Republicans have higher
average support scores in both the House and Senate.
This article is a part of the Tech Law Journal
Congressional Scorecard 1998 series. All 100 Senators and all 435
Representatives were rated on a 0 to 100 scale on the basis of their support for high
tech. The scorecard utilized five objective criteria (roll call votes on, and
sponsorship of, bills pertaining to encryption, Internet tax moratorium, securities
litigation reform, H1B visas, as well as membership in the Internet Caucus).
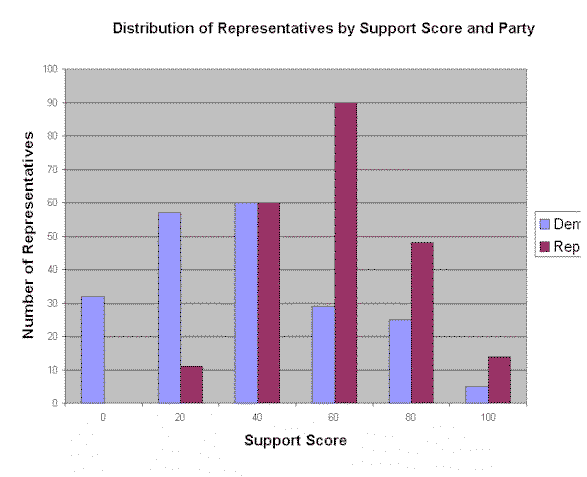
In the Senate, the average high tech support score for the Republicans was 59.44, while the average support score for the Democrats was 35.56. In the House, the average Republican score was 60.18, and the average Democratic score was 37.40. This data is set out in Table 1, below.
Table 1: |
||
House |
Senate |
|
| Republicans | 60.18 (227) | 59.64 (55) |
| Democrats | 37.40 (208) | 35.56 (45) |
| Total | 49.29 (435) | 48.80 (100) |
Of course, several of the top scoring Representatives and Senators were Democrats. Of the twenty-three House members with scores of 100, eighteen were Republicans, and five were Democrats: Anna Eshoo (D-CA), Sam Farr (D-CA), Bart Gordon (D-TN), Zoe Lofgren (D-CA), and Robert Matsui (D-CA). At the bottom end of the scale, all thirty-two of the Representatives with scores of 0 were Democrats.

In the Senate, three of the five Senators with scores of 100 were Democrats: Pat Leahy (D-VT), Patty Murray (D-WA), and Ron Wyden (D-OR). However, of the sixteen Senators with scores of 80, only two were Democrats: Barbara Boxer (D-CA) and Charles Robb (D-VA). Also, all nine of Senators with scores of 0 were Democrats These were Joe Biden (D-DE), Dale Bumpers (D-AR), Robert Byrd (D-WV), Russ Feingold (D-WI), John Glenn (D-OH), Carl Levin (D-MI), Pat Moynihan (D-NY), Paul Sarbannes (D-MD), and Paul Wellstone (D-MN).
There is also a high statistical correlation between party and support scores. The correlation coefficient for the House is .44. It is .47 for the Senate. Moreover, the correlation between party and support scores is higher than for any other variable measured (including gender, race, racial makeup of district, age, length of service, region, and rural makeup of district).
While there is a strong correlation between party and support scores, no explanation for this finding is offered in this series of articles. Nor is it argued that there is a causal relationship. There are several reasons for cautiously approaching any conclusion that that there is something about being a Republican that makes legislators more supportive of high tech. Other factors may also be involved. First, support for high tech correlates with both age, and length of service in Congress. Because the Republican sweep in the 1994 brought into office a large number of younger people, the Republicans on average are younger and have fewer years of service. Second, support scores are correlated with region. "Rust belt" legislators have lower average support scores, and Westerners have higher average support scores. Rust belt areas tend to elect more Democrats, and western states tend to elect more Republicans (especially in the Senate). Third, support scores are correlated with race, and the racial makeup of the district. Almost all black legislators are Democrats.